Product Description
FS5 Spectrofluorometer
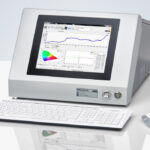
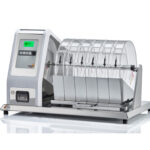
The FS5 is a fully integrated, purpose-built spectrofluorometer designed to meet the highest measurement specifications in the research and analytical markets.
With optical components and detectors of the highest quality, photon-counting sensitivity, and fluorescence lifetime capabilities, the FS5 can handle the speed of routine analysis and the sensitivity of demanding research requirements.
This benchtop spectrofluorometer can be configured with multiple sources and detectors without a change to its compact footprint. The standard FS5 system features a photon-counting PMT detector for fluorescence spectra in the visible range as well as an absorption detector. Measurements in the NIR up to 1650 nm, time-resolved fluorescence or phosphorescence, photoluminescence quantum yields or anisotropy can all be performed in the FS5 with suitable upgrade routes.
| Specification | |
|---|---|
| Optics | All-reflective for a wavelength independent focus with high brightness (small focus) at the sample |
| Source | 150 W CW Ozone-free xenon arc lamp (UV-enhanced ozone generating option available) |
| Monochromators | Czerny-Turner design with dual grating turret; plane gratings for accurate focus at all wavelength and minimum stray light |
| Spectral Coverage – Excitation | <230 nm – 1000 nm |
| Spectral Coverage – Emission | 200 nm – >870 nm |
| Filter Wheels | Fully automated; included in both the excitation and emission monochromators |
| Bandpass – Excitation/Emission | 0 to 30 nm, continuously adjustable |
| Wavelength Accuracy – Excitation/Emission | ± 0.5 nm |
| Scan Speed – Excitation/Emission | 100 nm/s |
| Integration Time | 1 ms – 200 s |
| Emission Detector | Photomultiplier, spectral coverage 200 nm – 870 nm, cooled and stabilised |
| Reference Detector | UV enhanced silicon photodiode |
| Transmission Detector | UV enhanced silicon photodiode |
| Signal-to-Noise Ratio of Water Raman Signal | SNR SQRT >10000:1 |
| Dimensions | 104 cm (w) x 59 cm (d) x 32 cm (h) |
| Weight | 55 kg |
Software
Fluoracle® is the operating software for the FS5 Spectrofluorometer. It controls all FS5 steady state and time-resolved spectrometer features with a straightforward design concept: focus on all modern photoluminescence spectroscopy applications and provide a user-friendly interface with ‘ready to publish’ outputs. Whether you select a basic spectral scanning version of FS5, or you go for an advanced version that includes TCSPC lifetime measurements or integrating sphere measurements, the all-inclusive software will provide instrument options automatically, from data acquisition to analysis and presentation.
Upgrade to FAST Software for advanced fluorescence lifetime analysis.
Measurement Examples
Emission Scans – with temperature dependence
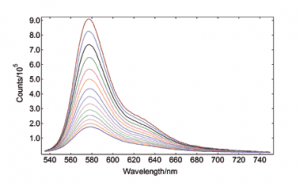
Rhodamine B, unlike other Rhodamine derivatives, has a chemical structure that is not entirely rigid. Consequently, the diethylamino groups interact with the solvent’s temperature, affecting the molecule’s excited-state population and dynamics through torsional motion. This causes the fluorescence intensity to have a strong dependence on the sample temperature, which can be seen below as measured with the TE cooled sample holder.
Rhodamine B in water, OD at 525 nm = 0.1 Spectral Band width: 2.5 nm, integration time per point: 0.1 s Temp Accuracy Band: 0.5ºC, Temp Stabilisation Time: 10 min
Excitation Scans – with pH dependence
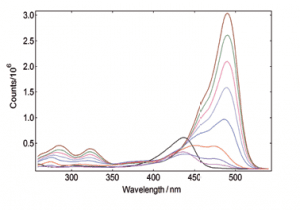
Fluorescence excitation spectra are more selective than absorption spectra, as they reveal, by virtue of the selected emission wavelength, where the molecule can absorb photons to prodcue a particular emitting species. Accurate excitation spectra require a sensitive instrument, as the concentration of the sample must be kept low to avoid inner filter effects, and require reliable spectral correction to ensure proper spectral representation.
Fluorescein in water, with pH 2 – 7 adjustments. Spectral Band width: 1.5 nm, integration time: 0.1 s pH adjusted between pH= 2 (blue shifted spectrum) and pH = 7 (spectrum of maximum intensity)
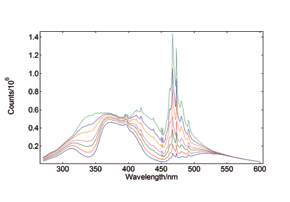
Synchronous Scans – with concentration dependence
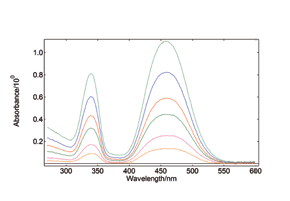
In synchronous spectral scans, the excitation and emission monochromators scan at the same time with a fixed wavelength offset, typically from 0 – 20 nm of offset pending the application. For dilute mixtures, this type of scan is used to identify species with a strong overlap between absorption and emission. Synchronous scans, together with the integrating sphere attachment, can also be used to measure the transmission/reflectance/absorption spectra of strongly scattering powders.
YAG: Ce powder, diluted with BaSO4 to study the effect of re-absorption/emission, concentration change from 100% down to 20%. The software wizard is used to calculate the Absorbance (left) from the raw data of synchronous scans (right).
Absorption Scans / Kinetic Scans
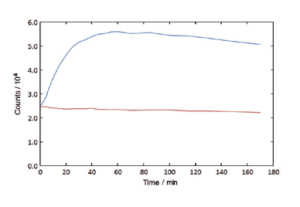
The FS5 can record the time course of a fluorescence signal, and, at the same time, record the signal transmitted through the sample. This enables experiments to be performed with chemically or biologically unstable samples, or with samples where very small changes need to be measured very accurately. The transmission detector is standard in the FS5.
Caspase Assay, fluorescence time course recorded for a 100% enzyme addition (blue) and a 0% enzyme control (red). Peptide cleavage is recorded by an organic dye excited at 400 nm, emitting at 460 nm.
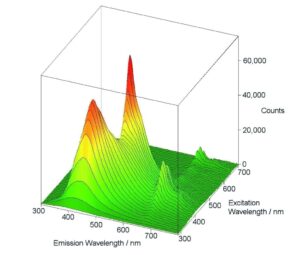
Excitation-Emission Maps
Excitation-Emission Maps (EEMs) provide a ‘Finger Print’ of complex mixtures of substances. These maps are typically measured either by a series of emission scans with stepwise increase, or for synchronous maps, by a series of synchronous scans and stepwise increase of the excitation-emission offset. A map measurement over a wide range of excitation and emission wavelengths, as shown here, can only be performed properly if higher order scatter is automatically removed during the measurement; the FS5’s built in automatic filters, along with real-time correction for background noise and spectral efficiencies, allow these measurements to be seamlessly performed by even the newest users.
Batch Measurements (Batch Mode)
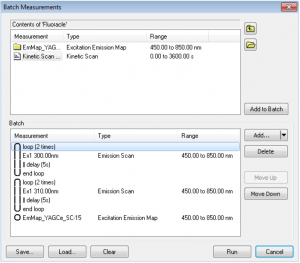
Combinations of excitation, emission, synchronous scans, excitation-emission or synchronous maps can be run in Batch Measurements. This means that several scans can be set for a sample and measured automatically without the presence of the user. The scans can be set to repeat in loops as many times as required, with a fixed pre-set delay between each scan. The batch measurements (protocols) can be saved and loaded for future use.
Measurements of absolute fluorescence quantum yield
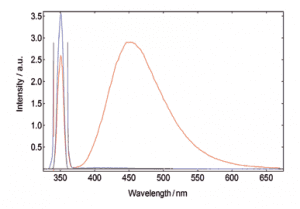
Fluorescence quantum yields can be measured by using the optional, sample chamber mounted, integrating sphere. The absolute method directly compares the number of absorbed and emitted photons through measurement of a blank-reference and a sample where their spectra can be integrated with respect to each other. The quantum yield calculation is made using a wizard within the operating software.
Quinine bisulphate in Perchloric acid. The red curve shows the scan over the excitation scatter at 350 nm and the emission of the sample, the blue curve shows the scatter of the blank measurement. The sample and blank-reference emission range (370 – 700 nm) has been increased by a factor 100 for better demonstration.
Chromaticity and Colour Co-ordinates
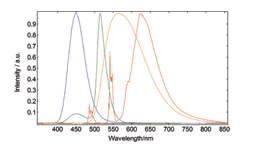
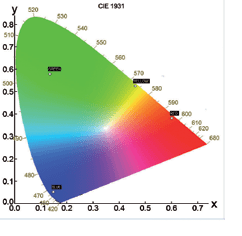
The lighting industry requires precise determination of the colour co-ordinates of fluorescent powders. The FS5 and Fluoracle Software provides Chromaticity analysis tools for the determination of colour co-ordinates and luminosity values using CIE 1931 and CIE 1976. The example shows four commercial powders with blue, green, yellow and red emission.
Plate Reader
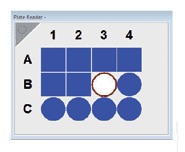
The SC-41 Plate Reader Module is an accessory for measuring samples in microplates of up to 384 wells. As with all sample holder accessories, this microplate reader is compatible with FS5 upgrade options such as NIR detection and time-resolved photoluminescence
Upgrades
- Time-Resolved Measurement Upgrades
- Spectral Range Upgrades
- Polarisation Upgrade
- Sample Holders / Cassette Upgrades
- MicroPL Upgrade
- Software Upgrade
FS5 Spectrofluorometer
- Measuring the Two-Photon Absorption Spectra of Organic Solutions Via Two-Photon Induced Fluorescence Spectroscopy
- Emission Tail of Indium Phosphide Quantum Dots Investigated using the FS5 Spectrofluorometer
- Identifying Thermally Activated Delayed Fluorescence (TADF) using an FS5 Spectrofluorometer
- Electroluminescence and Photoluminescence Spectroscopy of a Phosphorescent Organic Light Emitting Diode (PhOLED)
- Molecular Beacon Probe Fluorescent Detection of DNA
You can find all of our Application Notes here.
FS5 Spectrofluorometer Brochure
FS5 Spectrofluorometer Datasheet
